Log Files
Log Browser assists you in troubleshooting issues with your websites by
parsing the web server logs and displaying relevant warnings and error
messages in the Plesk![]() Plesk Panel is the preferred choice for hosting service providers, web designers, and website owners. Plesk Obsidian 18 is the latest release from Plesk and offers a range of new benefits and features for every user type. interface.
Plesk Panel is the preferred choice for hosting service providers, web designers, and website owners. Plesk Obsidian 18 is the latest release from Plesk and offers a range of new benefits and features for every user type. interface.
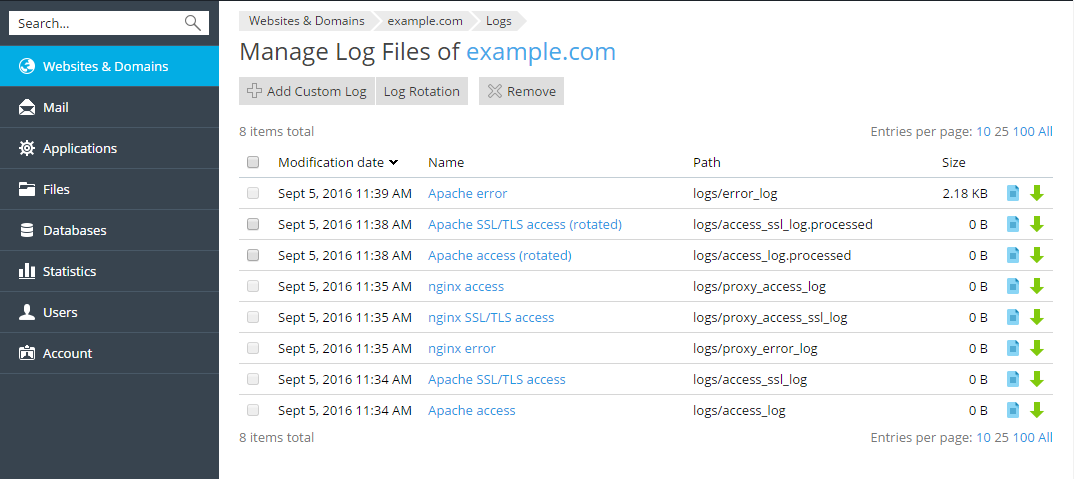
The information from the following log files is displayed by default:
- Apache
 The Apache HTTP Server, commonly referred to as Apache, is a web server software notable for playing a key role in the initial growth of the World Wide Web. In 2009 it became the first web server software to surpass the 100 million website milestone. access (access_log). This log records all HTTP
 HTTP: Hypertext Transfer Protocol is an application-layer protocol for transmitting hypermedia documents, such as HTML. It was designed for communication between web browsers and web servers, but it can also be used for other purposes requests
processed by the Apache web server.
 - Apache ssl access (access_ssl_log). This log records all HTTPS
 HTTPS: Hypertext Transfer Protocol Secure is an extension of the Hypertext Transfer Protocol (HTTP). It uses encryption for secure communication over a computer network, and is widely used on the Internet. In HTTPS, the communication protocol is encrypted using Transport Layer Security (TLS) or, formerly, Secure Sockets Layer (SSL). The protocol is therefore also referred to as HTTP over TLS, or HTTP over SSL.
requests processed by the Apache web server.
 - Apache error (error_log). This log contains diagnostic information. It also records any errors that the Apache web server encounters in processing requests.
- nginx access (proxy_access_log). This log records all HTTP requests processed by the nginx proxy web server.
- nginx ssl access (proxy_access_ssl_log). This log records all HTTPS requests processed by the nginx proxy web server.
- nginx error (proxy_error_log). This log contains diagnostic information. It also records any errors that the nginx proxy web server encounters in processing requests.
In addition, you can add any custom log file from you web site directory to track it in the Log Browser, as described below.
Access Log Browser
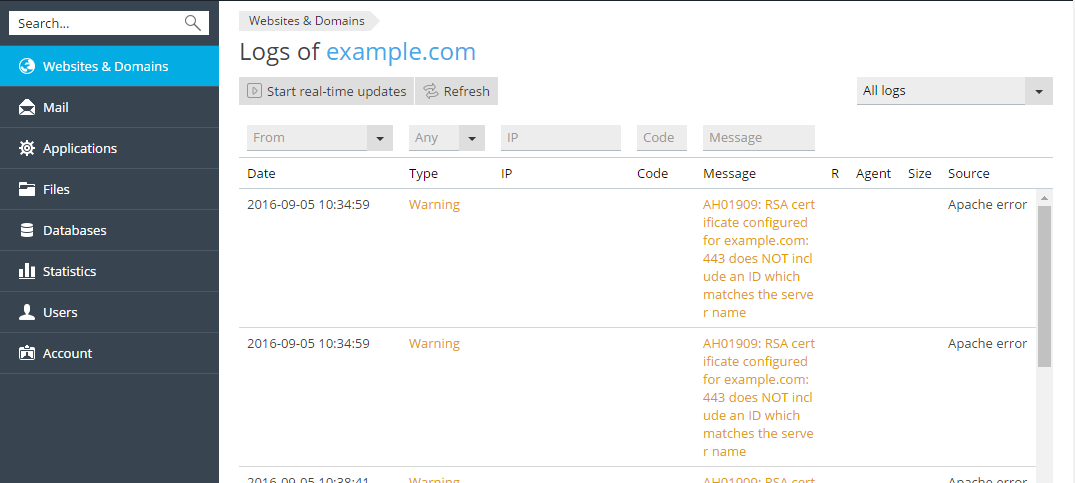
To access the Log Browser, go to Websites and Domains > Logs. You will be presented with a list of messages gathered from the logs. By default, the Log Browser displays messages present in the monitored logs at the moment of opening. If you want to refresh the list with messages added after opening the Log Browser, click Refresh. Alternatively, if you want to have new messages continuously added to the list, click Start real-time updates.
To select the logs from which you want to view messages, click the
 icon, and select the desired logs from the menu.
Manage Log Files
To view all the messages in a log, go to Websites and Domains >
Logs > click the  icon > Manage log files. The
list of all tracked log files will be displayed.
Here you can click a log file name to view the file content directly in
the Log Browser. You can click the  icon next to a
log file to open it for viewing in a separate window, or
the
  icon to download it.
To save disk space, you can enable log rotation that is automatic
compressing and/or deleting outdated website log files. To set up log
rotation, go to Websites and Domains > Logs > click the
 icon > Manage log files > Log Rotation.
You can delete log files that have been rotated (log files that have not yet been rotated cannot be removed).
Add a Custom Log File
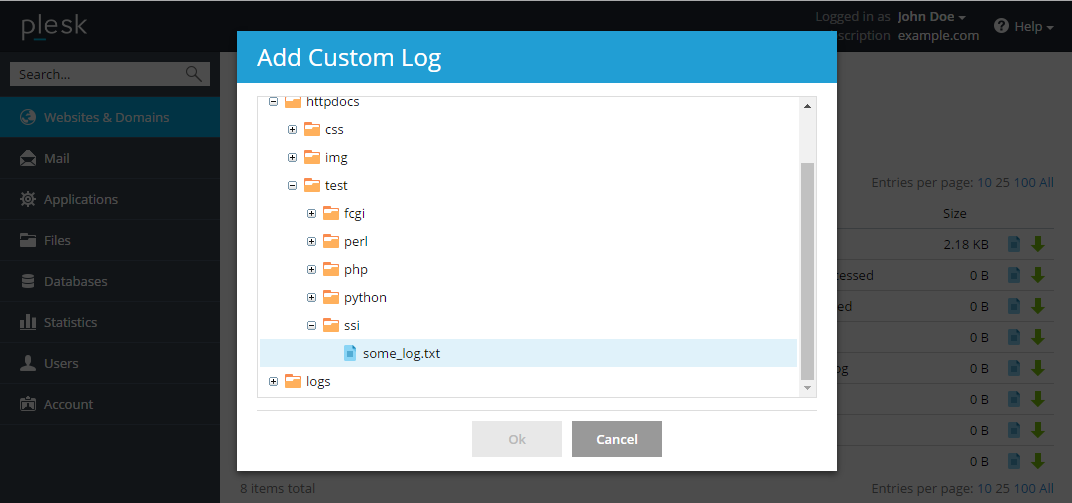
You can add any custom log file from you web site directory to track its changes in the Log Browser. To do this, click the Add Custom Log button on the Manage Log Files page. The tree with your web site folders will be displayed. Select the file that you want to add to the Log Browser and click OK.
| NOTE: Only plain text files can be selected. In order to be properly displayed, your custom log file should have timestamps for each log entry, otherwise it will not be parsed correctly. |
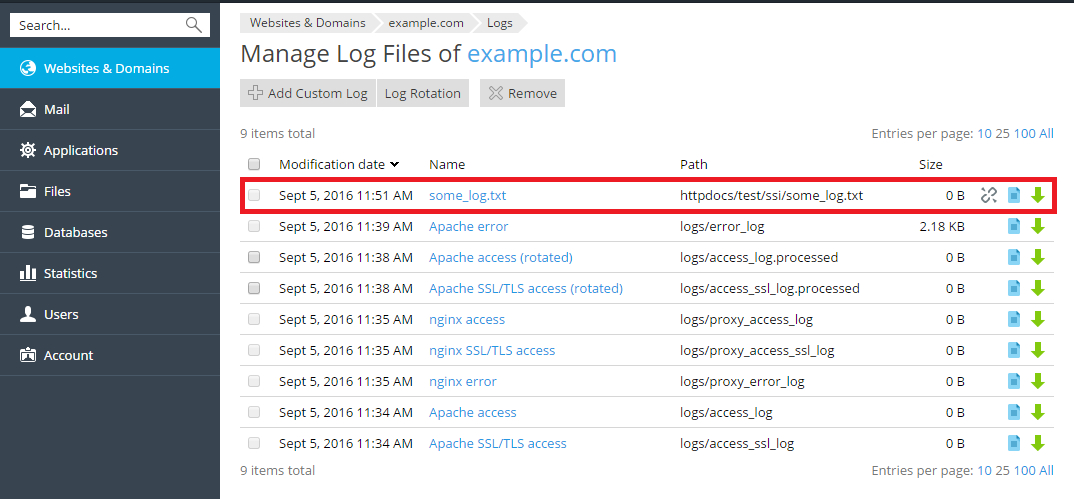
As a result, the selected log file will be displayed in the list of managed log files.
If you no longer want to monitor this custom log file, click
the  icon next to it. This does not remove the file
from your file system, but simply removes the file from the list of
files available in the Log Browser.
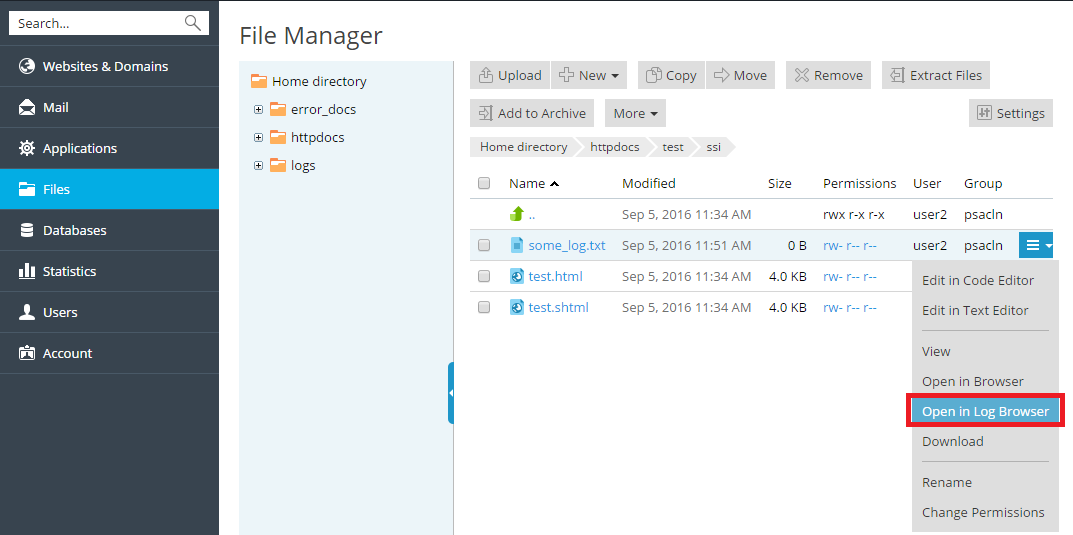
You can also open a text file in the Log Browser directly from the File Manager, using the Open in Log Browser option.
When you open a log file from the File Manager in the Log Browser, it is not yet added to the list of logs viewed in the Log Browser on a permanent basis. To add the file to the Log Browser, click the Add to Log Browser as Custom file button.
| NOTE: Log rotation is not available for custom log files. |
